

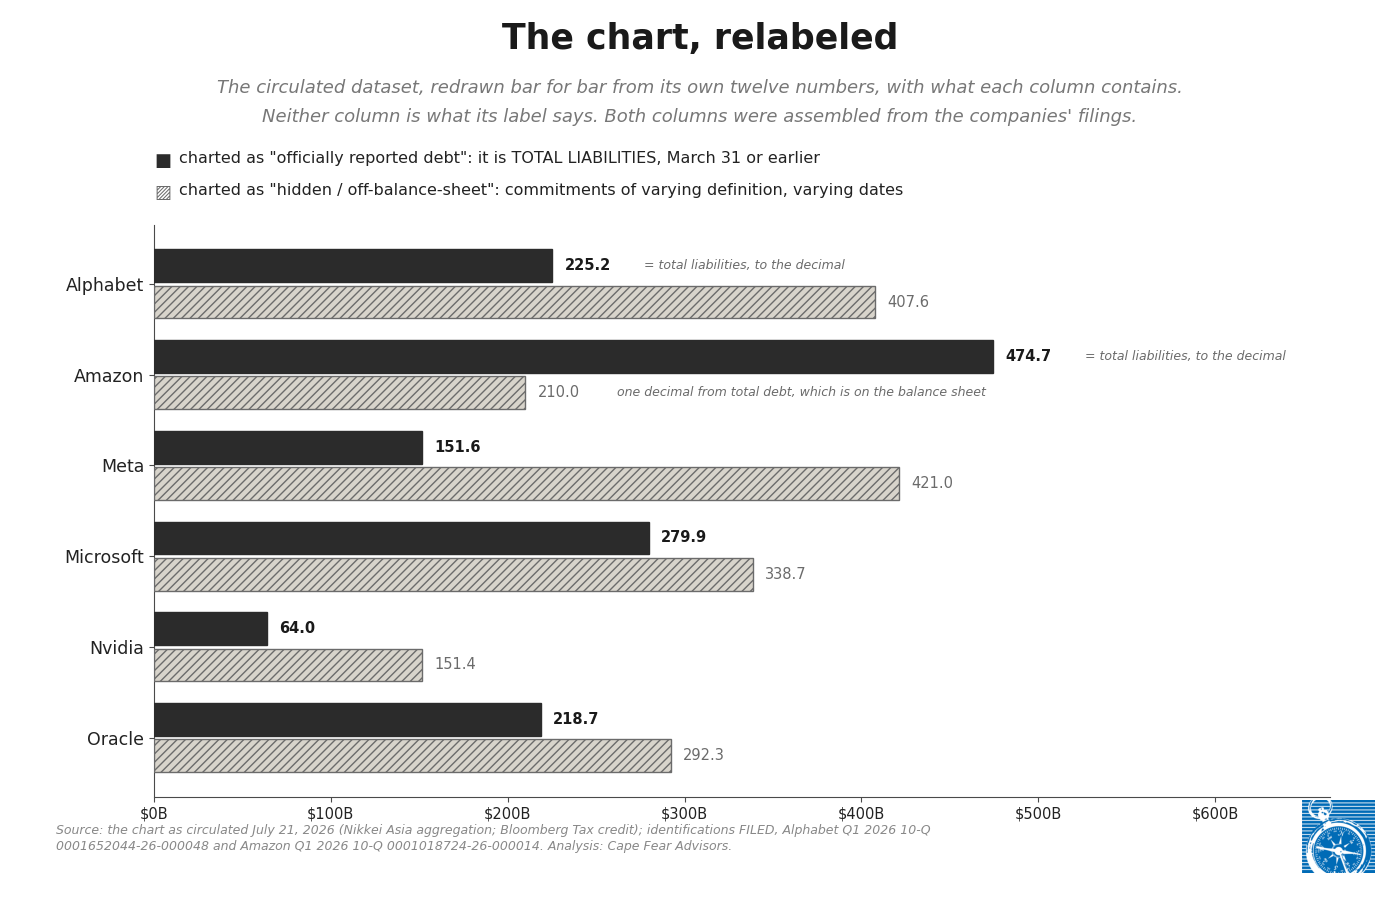
This piece corrects a framing, not a fear. The fear underneath the chart is real, and this piece hands it back sharpened, with the numbers rebuilt from filings dated inside the last ten days. What it takes away is the word “hidden,” because the word is doing damage: it teaches readers that disclosure is concealment, and a reader taught that is disarmed in the one place the record had armed them. The record holds the real number, and this piece reads it out, which is what this shop does for the reader.
The chart, and its journey
In late July a chart began traveling: six of the largest technology companies, two bars each, one labeled reported debt and one labeled off-balance-sheet obligations, with the second bar taller than the first for most of the names. The totals attached to it say the group reports about $1.35 trillion of debt and carries about $1.65 trillion more off the balance sheet. The aggregation traces to an investigation by Nikkei Asia, and the aggregation was real work: reporters went company by company through lease schedules and commitment disclosures and added up what they found. The label is where it went wrong, and the label is what traveled.
By the time the figure reached the largest audiences it had begun to drift, $1.65 trillion becoming $1.7 trillion becoming “maybe $1.8 trillion,” $1.35 trillion becoming $1.4 trillion, inside single retellings. The wobble tells on the figure, which had come loose from its source. This piece takes it back there. The carrying itself did a service no filing can do on its own: it put a real question in front of an audience the size of a country. The question deserved that audience. It also deserved the right number, and the right number was sitting in the filings the whole time.
Two things are true at once, and the piece holds both. The buildout’s financing is a legitimate worry: the same week the chart traveled, Goldman Sachs put the four largest builders’ combined capital spending through 2030 at $5.3 trillion, S&P Global put this year’s borrowing by the group at up to $400 billion, and the bond market began to say so out loud. All REPORTED, all in the right direction. The people carrying the chart are sensing the right thing.
But if a bubble is what they believe they are looking at, an aggregate is the wrong instrument for seeing one. At the level of a segment, a bubble exists only as a mirage. Bubbles resolve as specific companies, with specific balance sheets, specific customers, and specific costs of capital, and the winners and losers of this cycle will be sorted by exactly the differences an aggregate dissolves. The instinct behind the chart is sound. The frame answers a company question with a segment number, and that frame needs three repairs: the numbers were never hidden; the concern lives in different numbers than the ones the chart selected; and the concern has particular addresses. All three repairs come straight from the filings, and the filings have refreshed since the chart printed. This piece makes them.
It was never hidden
The first question for anything called hidden is where it was found. The answer, for every dollar of the $1.65 trillion, is: in the filings.
Public companies disclose their lease obligations in a lease footnote, including a year-by-year schedule of the undiscounted payments they have signed up for. They disclose purchase obligations, the contracts to buy power, chips, cloud capacity, and construction, in a commitments disclosure. They disclose leases they have signed that have not even started yet, with the amounts and the terms. The investigation’s method, by its own description, was to read those disclosures and add them. That is honorable work; it is also the opposite of discovering concealment. A number that can be assembled from the documents is not hidden. Described plainly, the finding is that the companies’ filings contain the information the filings are required to contain.
There is a genre of discovery that consists of opening the statements and being surprised by what was always there, the way one might report finding cash on the balance sheet. The surprise is real. The concealment is not.
One outside witness, because he said it better than the chart’s retellers and the day before the biggest filing of the week: Aswath Damodaran, writing on July 29 about disclosure policy, observed that nearly everything of value to him in an earnings report “is in the financial statements and footnotes,” not in the risk-factor prose or the guidance. That is the entire method of this shop stated by the most read valuation teacher alive. The footnotes are not where the bodies are buried. They are where the bodies are listed.
It is not in those numbers
The shop rebuilt the chart’s rows from the primary record, and both columns turned out to be something other than their labels. The result is a chart that overstates and understates at the same time, which is why the headline cannot hold even though the instinct behind it can.
Start with the column called reported debt, the overstatement. Alphabet’s entry is 225.2. Alphabet’s total liabilities at March 31, 2026 were $225.173 billion, FILED in the Q1 10-Q. Amazon’s entry is 474.7. Amazon’s total liabilities at March 31, 2026 were $474.716 billion. Two rows, each tying to the decimal, and not to debt: to total liabilities. Total liabilities is not debt. It includes the money owed to suppliers for goods already delivered, the revenue collected but not yet earned, the taxes accrued, the ordinary operating plumbing of enormous businesses.
Microsoft’s fresh 10-K, filed July 29, shows what that mislabel does. Total liabilities: $315.99 billion. Inside that figure sits $75.7 billion of unearned revenue, which is cash customers have already paid Microsoft for services not yet delivered. The chart’s method counts a company’s paid-in-advance order book as concealed debt. Microsoft’s borrowed debt is $40.3 billion against $76.8 billion of cash and short-term investments; the company presented as one of the largest concealers of debt holds nearly twice what it owes.
Then the understatement, and it is the more important half. The forward obligations, the thing the chart wanted to measure, have grown past the chart at the very companies it charted, because these numbers update in public on a clock and the clock just ran. The chart carries Microsoft’s off-balance-sheet column at 338.7, a March vintage. Microsoft’s July 29 10-K states the same category, freshly signed: $557.7 billion of obligations not on the balance sheet ($329.1 billion of leases signed but not yet commenced, $194.1 billion of purchase commitments, $34.6 billion of construction commitments), and $743.8 billion of total contractual obligations counting debt and interest, of which $241.9 billion falls due in fiscal 2027 alone. The chart carries Alphabet’s second column at 407.6; Alphabet’s July filing put the comparable pile near $810 billion. The chart carries Meta’s first column at 151.6; Meta’s balance sheet printed $188.7 billion on July 29, a quarter later and 24 percent higher, and the driver is the least hidden item in finance, $24.9 billion of bonds sold during the quarter and stated on the face of the cash flow statement.
So the columns miss in both directions at once: padded with operating plumbing that is not debt, and stale against commitments that grew tens of percent per quarter in plain sight. The repair is in the same documents the chart was built from, one filing cycle later.
The columns also overlap. Since the lease-accounting change of 2019, the discounted value of operating and finance leases already sits on the balance sheet, inside total liabilities. To the extent the second column carries the undiscounted versions of those same leases, the same buildings appear once in each column of a chart whose premise is that the columns are separate piles.
The same lease, at three sizes
The discounting matters because the two columns are measured in different kinds of dollars, and Microsoft’s fresh filing states one estate at three sizes on adjacent pages.
On the balance sheet, discounted to present value: $88.5 billion of lease liabilities ($21.9 billion operating, $66.6 billion finance). In the footnote’s maturity tables, the same leases undiscounted: $114.4 billion. And then the sentence the chart’s readers were told was a secret, printed in Note 13: “As of June 30, 2026, we had additional leases, primarily for datacenters, that had not yet commenced of $329.1 billion.” Those leases commence between fiscal 2027 and fiscal 2033, with terms of one to twenty years. One estate: $88.5 billion in today’s dollars on the balance sheet, $114.4 billion at gross face for the same signed buildings, $443.5 billion including the buildings that do not yet exist as assets in use. The retellings call the third number hidden. In the filing, the sentence that discloses it begins with the words “we had.”
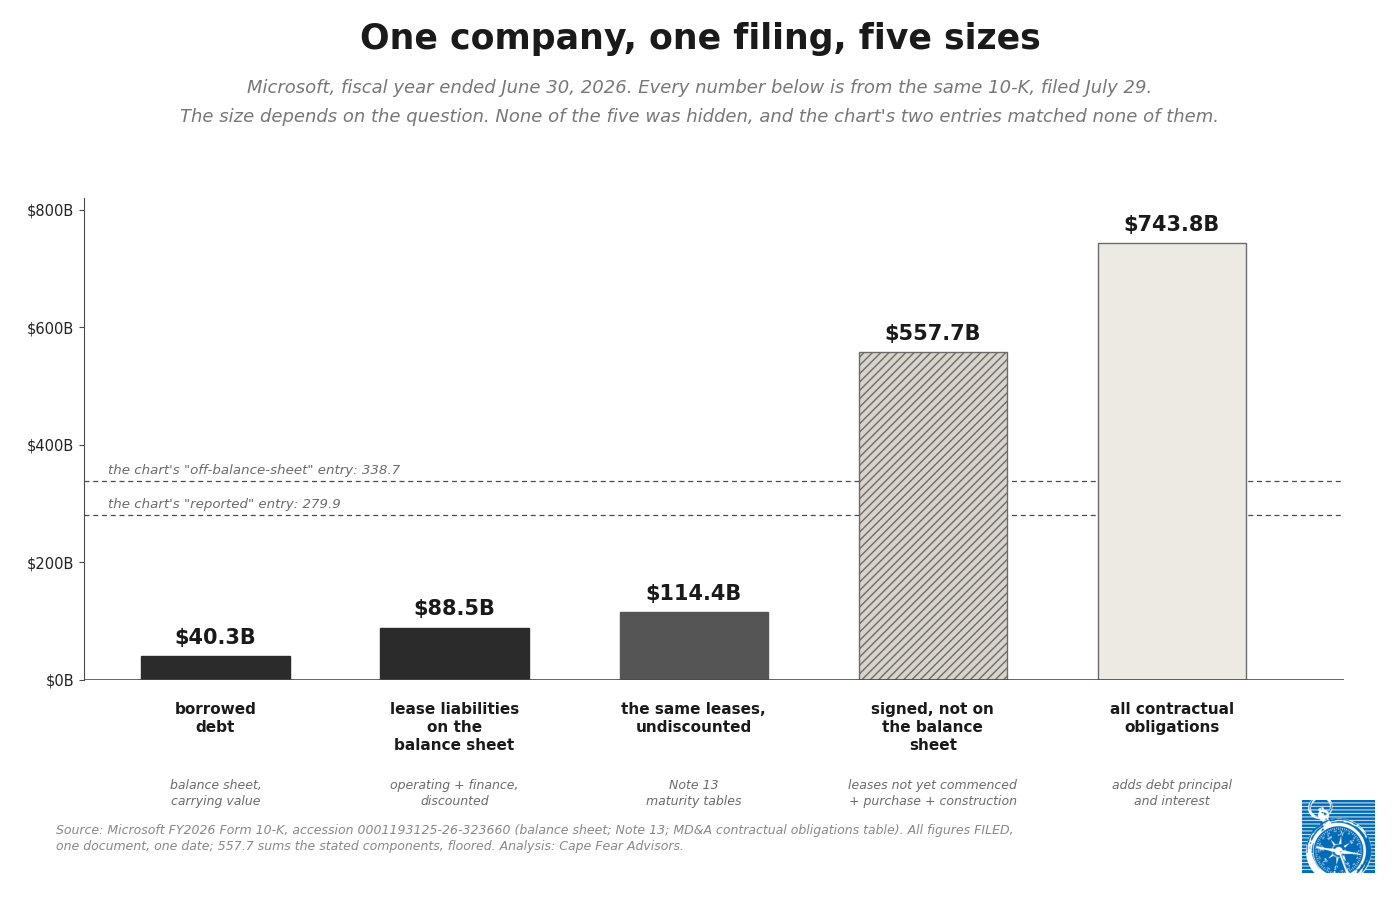
Comparing the undiscounted footnote total of one set of obligations against the discounted balance-sheet total of another set compares a decade of gross rent to today’s net borrowing, and calls the difference a secret.
A commitment is not a borrowing
The rest of the second column is purchase obligations: contracted future purchases of electricity, chips, cloud capacity, construction, and content. A purchase obligation is not debt. No money has been lent; in most cases nothing has yet been delivered. It is next decade’s electricity bill, disclosed today because the contract is signed. Some of these contracts can be canceled or reduced, on terms the disclosures describe; Microsoft’s are labeled take-or-pay, and this piece treats them at their largest defensible size throughout. Some will be paid out of the same years’ revenue that the capacity exists to earn. Adding ten years of operating inputs at face and calling the sum a debt load is a category decision, and it is the chart’s, not the filers’.
The chart’s largest second-column entry breaks apart on exactly these lines. Meta’s 421.0 is, per Meta’s own Q1 10-Q as read in Rod Dubitsky’s case study, $238 billion of non-cancelable purchase commitments plus $183 billion of leases signed but not yet commenced. The most frightening number on the card is, in its two named parts, buildings not yet occupied and hardware not yet delivered, each disclosed in the footnote built for the purpose, and neither one a borrowing. Meta’s Q2 10-Q will restate both figures within days, and the update will appear here in a dated comment, which is how a record that refreshes on a clock is supposed to be read.
There is a sharper version of this error inside the story’s own architecture. The retellings say, in one breath, that the companies have hidden their debt, and in the next, that the risk has been offloaded to the private credit funds financing data-center vehicles the companies merely rent from. Both cannot carry. If the obligation is a rental from an entity the filer does not control and does not guarantee, then what the filer owes is a lease or service commitment, disclosed, which is where the dataset came from. If instead the filer stands behind the vehicle through guarantees or residual backstops, that is a real question, the best question, and it is answered issuer by issuer in the guarantees and variable-interest-entity notes, which almost none of the retellings has opened. The one reader who did open one, the credit analyst Rod Dubitsky, found there exactly what this piece says the record holds: Meta’s own filing, quoted in his case study, stating a $2.4 billion carrying amount beside a maximum exposure to loss of $46 billion for a data-center venture Meta does not consolidate. He calls the structure hidden, and the word deserves one more turn, because his case study shows precisely what kind of hiding this is. The figure is not on the cover; it is in the note built to hold it, stated to the dollar. It is hidden the way anything in a book is hidden: a page must be turned. That is a real demand on the reader, and it is the only demand. Nothing else stands between the public and the number.
It is not a segment
These are not new companies, and they are not speculative ones. The youngest of the six has been public for well over a decade; the group holds some of the longest operating histories and the highest credit ratings in the market. Nor is the investment new in kind for them. Amazon has been building and leasing a continental logistics network for a quarter of a century and has been a cloud landlord since 2006; Microsoft’s commitments profile is the profile of a company that sells contracted cloud services to most of the world’s large enterprises and buys inputs at matching scale. The structures predate the buildout. The buildout is now growing them, and the right way to size the growth is by its dates, which the footnotes carry, rather than reading the whole stock of a decades-old way of operating as last quarter’s bet.
Even the word doing the grouping deserves suspicion. “Hyperscaler” is a label the companies apply to themselves, and it describes how big an activity is rather than how a business earns. A word that groups by size will always gather unlike balance sheets under one roof, and it does the reader a disservice even when the companies volunteer it.
The selection then cuts twice more, in opposite directions. It leaves out Apple, and certainly not for size or importance: as of this week Apple is, again, the most valuable public company in the world. It sits outside a frame whose boundary is a word, a label Apple has not applied to itself; its commitments profile is a different subject, and it gets its own reading on its own day. Membership in the category turns on a word the companies choose for themselves, which is the clearest possible sign that the category is a vocabulary, not an economics. And the selection leaves out the neoclouds, the companies exclusively committed to the buildout, where every dollar of invested capital is the bet and no older business cushions it. A category that includes six unlike incumbents while excluding both the largest company on earth and the pure participants is drawn around a story, not an exposure. The pure exposure lives outside the frame entirely, and this shop reads it separately, on its own filings.
And inside the frame, the six balance sheets are not one animal. Read the same categories of footnote across the six and the architecture differs at every house. Microsoft signs in its own name: the word “guarantee” appears zero times in its new 10-K, it consolidates no variable-interest entities, and its largest obligations are direct leases and take-or-pay contracts it will pay itself. Alphabet stands behind others: its filings disclose roughly $75 billion of financial guarantees, credit-derivative maximums, and estimated backstops, the group’s largest disclosed recourse set. Meta borrows in daylight and stands behind the group’s one large outside venture, $46 billion of maximum exposure against $2.4 billion carried. Amazon is the original lessor, with the largest on-balance-sheet lease stock, built across two decades. Nvidia’s number, a reported backstop of a customer’s data-center obligations, has not yet had to print in a filing; its next 10-Q is the door to watch. Oracle’s number is the oldest kind there is, leverage, carried against an order book roughly half of which rests on a single unrated customer, and the rating agencies have already said so out loud.
The bond market prices these differences every day: one company on the chart borrows at the highest rating the scale has, another trades a rung above junk. That discrimination is the entire content of credit analysis, and the chart erases it. A chart that cannot tell Microsoft from Oracle is not a warning. It is camouflage, and the names that benefit are exactly the ones that deserved the scrutiny the aggregate dissolved.
Building the number that matters
So build it properly. The number that should concern a reader answers four questions, and every one of them has a footnote address. How much is signed forward: the leases, commenced and not yet commenced, plus the purchase and construction commitments, at face, with dates. Who stands behind whom: the guarantees and VIE notes, where maximum exposure sits beside carrying value. How the signed obligations compare to the cash on hand and the cash the business makes each year. And who bears the loss if the wheel stops, which comes down to duration and leverage.
Two houses printed this week. Ask the four questions at both.
Microsoft, the counterexample
Microsoft’s FY2026 10-K, filed July 29, eight minutes after the close, answers all four questions at the largest scale anyone has ever filed, and the answers point away from the chart’s conclusion.
Signed forward: $557.7 billion off the balance sheet ($329.1 billion of leases not yet commenced, $194.1 billion take-or-pay, $34.6 billion construction), $743.8 billion all-in, $241.9 billion due in fiscal 2027. Standing behind whom: no one; zero guarantees disclosed, no VIEs consolidated, every obligation direct and in its own name. Against what resources: $76.8 billion of cash and short-term investments and $182.9 billion of annual operating cash flow, growing. Who bears the loss: Microsoft, alone, in daylight, at the highest rating the scale has.
There is still plenty to read. The same filing carries the real reading concerns, stated here so the contrast holds: unpaid capital expenditure sitting in accounts payable quadrupled to $26.7 billion, so the accrual commitment to plant runs ahead of the headline capex number; finance leases reached $66.6 billion, which makes Microsoft net-debt for the first time if leases count as debt, on the same day management said future leases will classify as operating instead; and the customer concentration is now filed rather than whispered, because Microsoft named OpenAI as a related party and disclosed $24.1 billion of revenue from it, a $6.0 billion receivable, and an order book that grew 84 percent with the customer and, management said on the call, 25 percent without it. Real questions, every one disclosed, none of them the chart’s question.
And then Microsoft closed the argument itself. Twelve hours after the filing, its chief executive posted a demonstration app built on a bank’s hyperscaler-returns analysis. The banner sentence on his own screenshot: “Capital is visible. Attribution is not.” The capex tile beneath it concedes the figure was “never labeled GenAI capex,” and the app’s own copy says it answers “the question the filings cannot yet answer directly.” The company’s own product states the true disclosure gap: not hidden obligations, but unattributed returns. The capital was never the secret. What the capital earns is the open question, and the filings say so themselves.
Meta, the example
Now the same four questions at the house where they bite, and they need nothing beyond the earnings release Meta furnished the same afternoon. What Meta REPORTED, alone, is enough.
Revenue grew 28 percent, and operating income fell 8 percent. Capital spending including finance-lease payments was $31.08 billion in the quarter; operating cash flow was $31.86 billion. Free cash flow: $784 million, against more than $8.5 billion a year earlier. The gap was funded where funding is done in daylight: $24.9 billion of bonds sold during the quarter, taking the debt line to $83.7 billion, with buybacks at zero all year and the capex guide raised at the floor to $130 to 145 billion. The real concern at Meta takes one sentence: the house now spends everything it earns on plant, borrows the difference, and stands behind the group’s one large outside venture at a disclosed maximum of $46 billion against $2.4 billion carried. Whether the spending pays is a question this shop holds no view on. That it is happening sits on the face of one 8-K, same-day, in five numbers.
That is the difference the chart flattened. One house signs a decade of rent it can pay out of the cash it makes every year, at the highest rating the scale has. Another house spends through its cash flow and borrows the difference, now. The first is scale. The second is strain. Both are disclosed to the dollar, and telling them apart is where the reading starts.
The ledger
The real numbers, stated once each, composition and date attached. Every figure below is FILED except where marked. And note the dates as they pass: the chart circulated on July 21, and everything below happened in the nine days since. This all happened this week. The record did not merely contain the answer; it re-filed the answer, larger and fresher, while the mislabeled version of it was still being passed around.
Microsoft. $557.7 billion signed off-balance-sheet ($743.8 billion all-in; $241.9 billion due FY2027); zero guarantees; $76.8 billion cash and $182.9 billion operating cash flow. 10-K filed July 29, 2026. The chart said 279.9 and 338.7; the K superseded both.
Alphabet. Purchase obligations and not-yet-commenced leases near $810 billion at the July print, beside roughly $75 billion of guarantees, credit-derivative maximums, and estimated backstops, the group’s largest disclosed recourse set. Q2 10-Q, July. The chart said 407.6.
Meta. $188.7 billion total liabilities after a $24.9 billion in-quarter bond raise; free cash flow $784 million; $46 billion maximum VIE exposure against $2.4 billion carried (Q1 figure). 8-K July 29; the Q2 10-Q follows within days and this row updates in a dated comment. The chart said 151.6 and 421.0.
Amazon. Prints tonight; its commitments rebuild and the resolution of the chart’s oddest row (a 210.0 “off-balance-sheet” entry that sits one decimal from Amazon’s on-the-face total debt) will be stated in a dated comment when the Q2 filing accepts. The pending status is the point: the number arrives on a schedule anyone can read.
Nvidia. The reported $250 billion customer backstop has not yet been required to print in a filing; if it becomes binding, the accounting requires the maximum potential payment to be stated in the next 10-Q, late August. The door is named so the reader can watch it.
Oracle. The one house where the caption’s fear and the filed record agree: roughly half of a $638 billion order book resting on a single unrated customer, leverage above four, a downgrade in hand and the agency’s own confession that it had underestimated the bet. FY2026 10-K, June. The chart said 218.7 and 292.3, and for once the chart understated the interesting number by more than half.
And the ledger has a row the chart never drew: the companies committed to nothing but the buildout, whose exposure is total by definition and whose filings state it plainly. They print on their own dates, beginning in mid-August, and this shop will read them the same way, one at a time.
What the record was missing
The trillion was never hidden. It was filed, dated, scheduled year by year, signed, and then, in the ten days after the chart circulated, updated in public and in most cases upward. What was missing was not disclosure. It was a reader.
That distinction is the working premise of everyone who reads filings for a living, and of every reader these pieces are written for. The companies get nothing from it, and they are owed no courtesy from here. The reader gets everything. The footnotes are where the risks are visible: the durations, the concentrations, the guarantees, the vintages, the customer named at one house and the returns unattributed at all of them. A chart that traveled this far teaching that the footnotes are where the bodies are buried would have taught something useful. Teaching instead that disclosure itself is the burial, it taught its readers to distrust the one part of the record that had it right, at the moment they most needed to read it.
The chart described a cube as a square. The face it drew is real. The object has more dimensions, and every one of them is in the documents, where it has been all along.
The trillion was never hidden. It was filed, dated, scheduled year by year, signed, and then, in the ten days after the chart circulated, updated in public and in most cases upward. What was missing was not disclosure. It was a reader.
Related, on the shelf: The Quality of Cash: What Has to Happen Next; The Croupier Counts First; Oracle, Adding It Up: One Column; Apple, the Immaterial House.
Standing Disclosure
Anthropic is the developer of Claude, which is used in preparing this research. Amazon, Alphabet, Microsoft, and Nvidia, named in this piece, hold positions in or supply Anthropic; Microsoft disclosed a $3.2 billion gain on an Anthropic investment the night before this piece printed. That nearness cannot be fully checked away, which is why no claim here rests on trust in the tool: every figure is quoted from the filers’ own documents with accession numbers stated, and any reader can rerun the arithmetic without reference to this shop or its tools. The same standard of reading is applied to every filer named.
Analysis: Cape Fear Advisors.
Notes
The dataset. The figures rebuilt here are the chart’s rows as circulated (in $ billions, first column and second column): Alphabet 225.2 and 407.6; Amazon 474.7 and 210.0; Meta 151.6 and 421.0; Microsoft 279.9 and 338.7; Nvidia 64.0 and 151.4; Oracle 218.7 and 292.3. The first-column sum excluding Nvidia is 1,350.1 and the second-column sum excluding Nvidia is 1,669.6, matching the circulated totals of about $1.35 trillion and $1.65 trillion. With all six names the columns sum to 1,414.1 and 1,821.0: the chart’s own headline totals omit one of its six companies, an assembly seam left visible in the numbers that traveled. The chart is therefore treated as the investigation’s dataset, and the correction is addressed to the dataset, not to any teller of it.
The two ties. Alphabet total liabilities of $225.173 billion at March 31, 2026 and Amazon total liabilities of $474.716 billion at March 31, 2026, each matching its first-column entry at one decimal. Two independent ties at that precision are treated as identification, not coincidence. Alphabet Q1 2026 10-Q, accession 0001652044-26-000048; Amazon Q1 2026 10-Q, accession 0001018724-26-000014.
Prior identification. In a sweep run before print, a July 23 fact-check by Kam Leung at Finterm was located that independently identified the chart’s first column as total liabilities, carrying the same decimal ties, and sorted the second column into uncommenced leases and purchase commitments. This shop’s derivation was independent and its workpapers date it; his was first in print, and that priority is acknowledged here, at the point where the finding is used.
The Amazon row. Amazon’s total debt including lease liabilities at March 31, 2026, $209.888 billion, sits one decimal from its second-column entry of 210.0. This note states the proximity and stops. If Amazon’s rebuilt commitments total lands near 210 independently, the entry is what the chart says it is and this note will be corrected in a stamped update; the piece’s argument does not lean on this row.
Microsoft figures. All Microsoft figures are from the FY2026 10-K, accession 0001193125-26-323660, accepted July 29, 2026, 16:08:01 ET: total liabilities and unearned revenue from the balance sheet; the three lease sizes from Note 13 and the MD&A contractual obligations table; purchase, construction, and debt figures from the same table; the OpenAI related-party figures from Note 1; operating cash flow from the cash flow statement. The $557.7 billion off-balance-sheet figure sums $329.1 billion (Note 13’s own stated rounding) plus $194.060 billion plus $34.566 billion and is floored, not rounded up, per this shop’s convention of rounding against its own argument. The 25 percent ex-OpenAI order-book growth and the prospective lease-classification change are from the July 29 earnings call as transcribed by a transcript service, REPORTED, and will be re-verified against the company’s official transcript.
Meta figures. All Meta figures are from the July 29, 2026 8-K, accession 0001628280-26-050596, Exhibit 99.1, REPORTED same-day by the filer; the commitment decomposition and VIE figures ($238 billion and $183 billion; $2.4 billion carrying, $46 billion maximum exposure) are FILED in the Q1 10-Q and will be refreshed from the Q2 10-Q in a dated comment when it accepts. The piece does not wait on that filing, and says so where the figures appear.
Discounting, stated fairly. The undiscounted maturity tables are not a flaw in the filings; they are required precisely so a reader can see gross contractual exposure by year. The flaw is in comparing them against discounted stocks as if the two were the same unit. Where this piece states multiple sizes for the same leases, all sizes come from the same filing on the same date.
Cancellability. Some disclosed purchase obligations are cancellable or adjustable and the disclosures say so where true. No cancellability is assumed anywhere in this piece’s arithmetic, which therefore states the commitments at their largest defensible size. Rounding runs against the piece’s own argument throughout.
What would change this reading. If the guarantees notes of the six filers, read at this week’s prints and the following 10-Ks, disclose sponsor recourse to financing vehicles at a scale approaching the commitments tables, then the off-balance-sheet framing gains a leg this piece says it presently lacks, and that finding would run here under its own headline. The door is named so the reader can watch it too. NVIDIA’s next 10-Q, late August, is the first scheduled reading, for any guarantee disclosure arising from the reported customer backstop.
The Meta case study. The decomposition of Meta’s second-column entry and the variable-interest-entity figures are credited to Rod Dubitsky’s July 28 case study, which quotes the disclosures from Meta’s Q1 10-Q; the figures are re-derived from the filing before print. One respectful difference of description: his piece calls the VIE structure “Enron style.” The variable-interest-entity rules were written after Enron precisely to force these disclosures into the filings, and the proof is the case study itself, which is built from them. Enron’s numbers were not available to be charted. These are.
The footnotes point. The observation that the value of an earnings report lives in the financial statements and footnotes rather than the surrounding prose is Aswath Damodaran’s, from his July 29 essay on reporting frequency, cited here because he reached this piece’s conclusion by his own road.
The Nadella post. “Capital is visible. Attribution is not,” the “never labeled GenAI capex” caption, and the app copy quoted are from Satya Nadella’s July 30 post on X presenting an application built on Morgan Stanley hyperscaler-returns research by Brian Nowak; the analysis underneath is the bank’s, labeled illustrative by the app itself. The same three questions this piece asks of the traveling chart apply to that application’s averages, and this shop will ask them if those figures begin to travel the way the chart did.
The proliferating totals. Within one week the circulating figures for the same idea ran $1.2 trillion (a rating agency’s 2026 data-center commitments), $1.65 trillion (the chart), $1.7 trillion and “maybe $1.8 trillion” (retellings). None of these tie to each other because each draws a different boundary: different companies, different obligation types, different dates. That the totals cannot agree is itself the finding: the only place the numbers tie is the footnotes they came from.
Apple. Apple is absent from the chart, and the absence is defensible: Apple has not applied the category’s word to itself, its commitments profile is a different subject, and this piece does not assert the compilers’ selection rule. It gets its own reading on its own day.
Sources. Nikkei Asia’s investigation is credited as the origin of the aggregation; the chart circulated under a Bloomberg Tax credit on July 21. Goldman Sachs capex forecast and S&P Global borrowing estimate as reported the week of July 27. Company figures FILED: Alphabet Q1 2026 10-Q, 0001652044-26-000048; Alphabet Q2 2026 10-Q, 0001652044-26-000071; Amazon Q1 2026 10-Q, 0001018724-26-000014; Microsoft FY2026 10-K, 0001193125-26-323660; Meta Q2 8-K, 0001628280-26-050596 (and Q1 10-Q for the commitment and VIE figures); Oracle FY2026 10-K, 0001193125-26-277521. Accession numbers are the bibliography and need no links.
Analysis: Cape Fear Advisors.
This article is also available on Substack.
Contact Cape Fear Advisors